I. Import data analysis
1. Cotton yarn imports kept shrinking
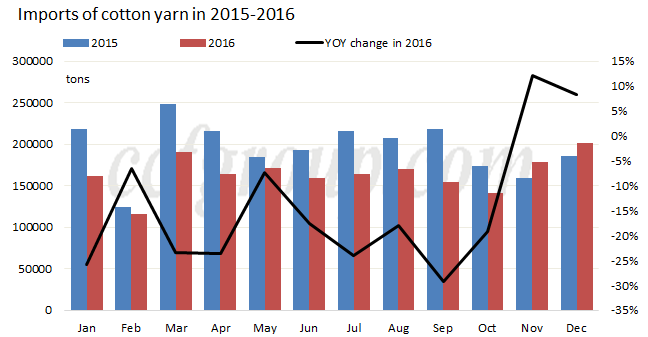
Imports of cotton yarn amounted to around 201.7kt in Dec 2016, up 8.3% y-o-y and 12.8% m-o-m respectively, and cotton yarn imports totaled around 1972kt throughout 2016, down 15.9% on the year. Imports of cotton yarn (Hs code: 5205, containing more than 85% of cotton) stayed at 191.7kt in Dec 2016, and declined 16.1% on the year to 1863kt throughout 2016.
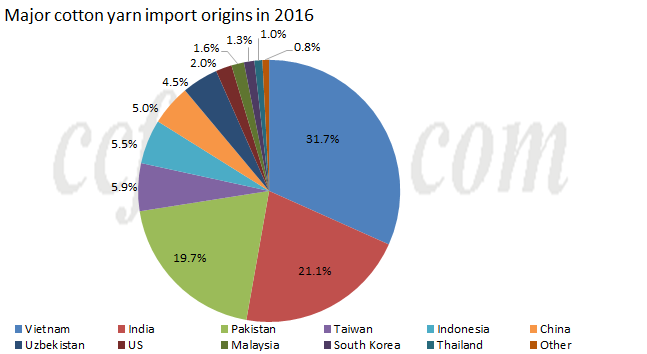
Vietnam, Pakistan and India remained the major import origins for cotton yarn in 2016, sharing around 75% of the total. Imports of Vietnamese, Indian and Pakistani cotton yarn were around 625kt, 416kt and 389kt respectively in 2016.Price advantage of Vietnamese cotton yarn waned in Dec but kept the largest import market. Imports of Indian cotton yarn surged greatly in Dec 2016 when price of Indian cotton yarn kept falling from mid-Oct, gaining price edge again compared with Vietnamese cotton yarn, and India surpassed Pakistan to be the second largest import origin in 2016. Pakistan still ranked the third position with advantage in siro-spun cotton yarn.
2. Deep analysis on cotton yarn imports (Hs code: 5505)
2.1 Major counts
Carded 8-25S/1 still dominated the import in Dec, with monthly import volume staying at 100.7kt, up 11.2% m-o-m. Imports of carded cotton yarn below 8S/1 and carded C25-30S/1 in Dec 2016 inched down on the month, and imports of combed 8-25S multiple plied yarn hiked 52.5% on the month.
| Imports of cotton yarn in 2016 by counts |
| Unit: kt |
Dec-16 |
MOM change |
2016 |
| Carded C8-25S/1 |
100.7 |
11.20% |
966.5 |
| Carded C30-47S/1 |
25.9 |
10.00% |
301.1 |
| Combed C30-47S/1 |
26 |
39.60% |
196.7 |
| Carded cotton yarn below 8S/1 |
9.5 |
-6.00% |
104.2 |
| Combed C25-30S/1 |
9.5 |
12.10% |
78.9 |
| Combed C8-25S/1 |
9.5 |
30.20% |
92 |
| Carded C25-30S/1 |
4.8 |
-7.50% |
45.9 |
| Carded C8-25S multiple plied yarn |
1.5 |
52.50% |
24.9 |
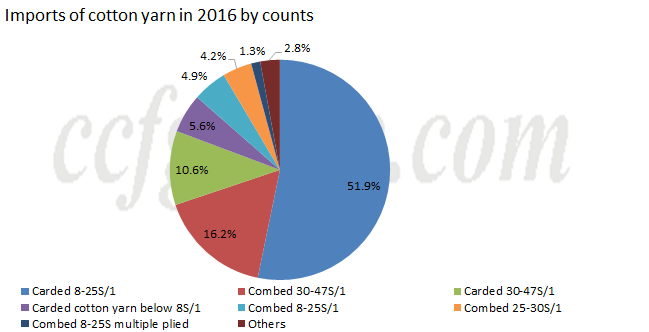
Carded cotton single yarn was the major imported cotton yarn in 2016, and carded 8-25S/1 ranked the first, with volume staying at 966.5kt in 2016, sharing around 51.9%, followed by carded 30-47S/1, accounting for 16.2% and staying at 301.1kt, and the next was combed 30-47S/1, possessing 10.6% and reaching 196.7kt. Market share of other counts was small.
2.2 Major import origins
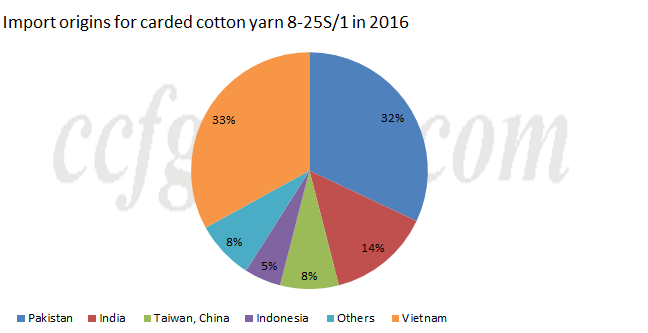
Vietnam and Pakistan were the biggest import origins for carded 8-25S/1 in 2016, possessing dominant role.
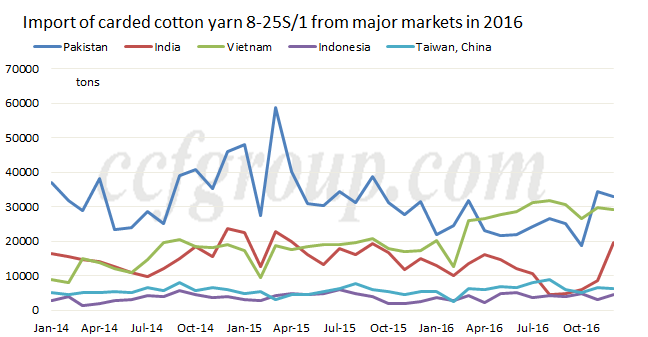
Vietnam surpassed Pakistan to be the biggest import origin for carded 8-25S/1 from Apr 2016, witnessing rising proportion, while Pakistan snatched India to be the largest origin in Nov and maintained in Dec. Proportion of other markets was small.
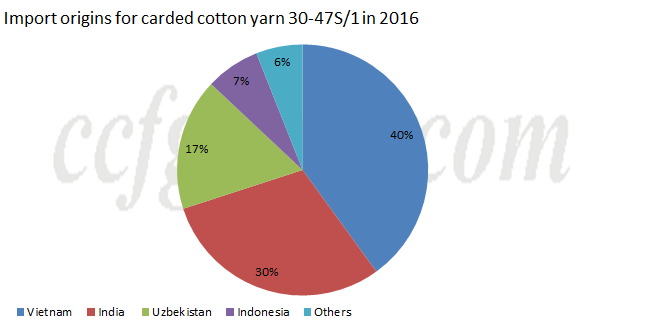
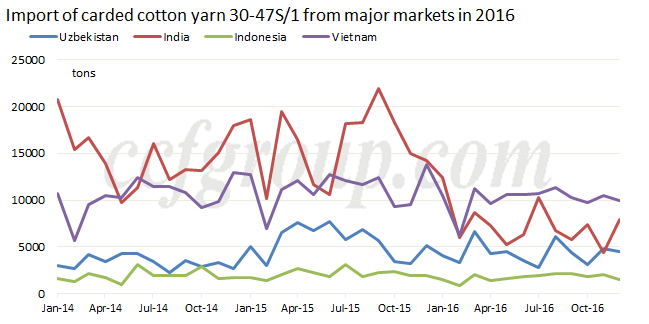
Vietnam and India enjoyed advantage in carded 30-47S/1, but Vietnam dominated the picture throughout 2016, followed by India.
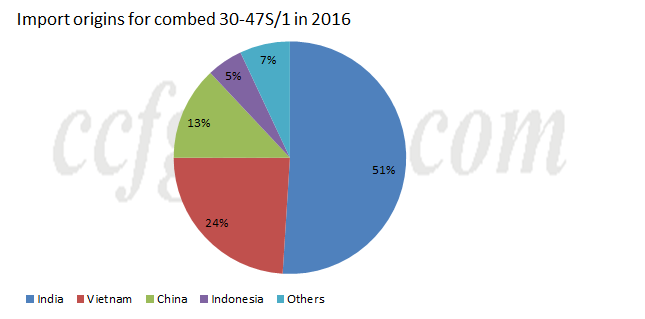

India enjoyed absolute advantage in combed 30-47S/1 before 2016, with market share far higher than other markets, but kept falling in 2016. In Aug 2016, India declined to the second position snatched by Vietnam for the first time and the gap with Vietnam enlarged in Sep, but India surged to the first position in Oct, and possessed bigger advantage in Nov and Dec.
2.3 Top 20 companies importing cotton yarn in 2016
| Top 20 companies importing cotton yarn in 2016 |
| Rank |
Carded C8-25S/1 |
Carded C30-47S/1 |
Combed C30-47S/1 |
| 1 |
Texhong (China) Investment CO.,LTD. |
ANHUI TIME TECHNOLOGYCO.,LTD. |
Bros Holding Limited |
| 2 |
CONBA Group |
Texhong (China) Investment CO.,LTD. |
Jiangmen Xinhui Guanhua Knitting Mill CO., LTD. |
| 3 |
GUANGDONG TEXTILES IMP. & EXP. COTTON,YARN & PIECE-GOODS?CO.,LTD. |
Shandong Ruyi Science & Technology Group |
Guangzhou Jinxing Textile Bleaching& Dyeing CO.,LTD. |
| 4 |
Shandong Ruyi Science & Technology Group |
Tianjin Textile Group I/E Co.,Ltd. |
Pacific Textile Holdings Limited |
| 5 |
Shanghai Tesihong Trade CO.,LTD. |
Ningbo Cimei International Trade CO.,LTD. |
Guangdong Silique Int'l Group Zhaofeng Logistics?Co., Ltd. |
| 6 |
CHINA TEXTILE INDUSTRIAL CO. FOR FOREIGN ECONOMIC & TECHNICAL COOP. |
BEIJING JINGMIAN TEXTILE IMP & EXP. CO., LTD |
Jinjiang Hengfeng Imp&Exp Trade CO.,LTD. |
| 7 |
SHANDONG JINING RUYI IMPORT AND EXPORT CO.,LTD. |
CHINA TEXTILE INDUSTRIAL CO. FOR FOREIGN ECONOMIC & TECHNICAL COOP. |
Guangdong Esquel Textiles Co., Ltd. |
| 8 |
C&D Logistics Group Co., Ltd |
Shandong DAIYIN Textile and Garment Group |
Guangdong Silique Int'l Group Wintex Co., Ltd. |
| 9 |
Guangdong Silique Int'l Group Wintex Co., Ltd. |
SHANDONG JINING RUYI IMPORT AND EXPORT CO.,LTD. |
Dongguan Shatian Lihai Textile Printing&Dyeing CO.,LTD. |
| 10 |
Xiangtan Dongxin Cotton Industry CO.,LTD. |
Wuhu Haide Export Processing Logistic CO., LTD. |
CHINA TEXTILE INDUSTRIAL?CO. FOR FOREIGN ECONOMIC & TECHNICAL COOP. |
| 11 |
Guangdong Silique Int'l Group Zhaofeng Logistics Co., Ltd. |
Xiamen Zhanglong Imp&Exp CO., LTD. |
Shandong Ruyi Science & Technology Group |
| 12 |
Wuhu Haide Export Processing Logistic CO., LTD. |
Jinjiang Hengfeng Imp&Exp Trade CO.,LTD. |
Zhucheng Apparel and Knitting Imp&Exp CO., LTD. |
| 13 |
JINFANG COTTON TECHNOLOGY CO.,LTD. |
Jining Runshi Imp&Exp CO., LTD. |
Shenzhen Huafu Imp&Expo CO., LTD. |
| 14 |
Keer Group |
HANGZHOU WANSHILI IMP. & EXP. CO.,LTD. |
Ningbo Huafu Donghao Industrial CO., LTD. |
| 15 |
ANHUI TIME TECHNOLOGYCO.,LTD. |
XIAMEN ITG TIDAK BONDED LOGISTICS CO.,LTD. |
JINFANG COTTON TECHNOLOGY CO.,LTD. |
| 16 |
BEIJING JINGMIAN TEXTILE IMP & EXP. CO., LTD |
CONBA Group |
Xiamen Naseem Trade CO., LTD. |
| 17 |
CHINA CO-OP GROUP NANTONG SUPPLY AND SALES INDUSTRIAL DEVELOPMENT CO., LTD. |
Zhejiang Zhongda Technical Import&Export Group Co., Ltd. |
XIAMEN JIASHENG FOREIGN TRADE CO.,LTD |
| 18 |
Shaoguan Shunchang Fabric CO., LTD. |
Zhejiang Textiles Imp&Exp Group CO., LTD. |
Guangzhou Panyu Jianye Import & Export Co., Ltd |
| 19 |
ZHEJIANG ZHONGDA GROUP INTERNATIONAL TRADING CO.,LTD. |
Heshan Taiyuan Trade CO.,LTD. |
Jilin Telai Textile Co., Ltd. |
| 20 |
Ningbo Cimei International Trade CO.,LTD. |
CHINA CO-OP GROUP NANTONG SUPPLY AND SALES INDUSTRIAL DEVELOPMENT CO., LTD. |
Shandong Haizhijie Textile CO., LTD. |
| Share |
55.40% |
55.40% |
57.10% |
3.Import unit price declined

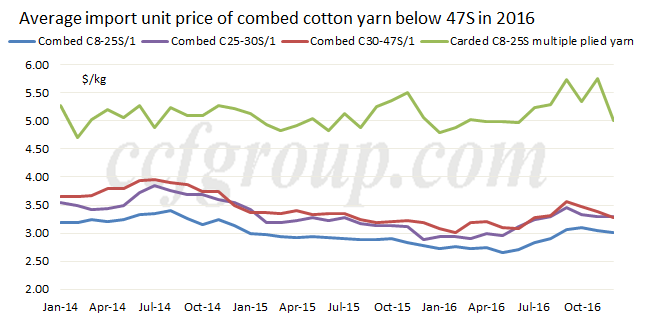
Import unit price of major imported cotton yarn kept moving down in 2016 and was in range bound in recent months.
In Dec 2016, import unit price of combed 25-30S/1 increased by 2.5% on the month, but that of other cotton yarn was stable to weak, and decrement of combed 8-25S multiple plied was the biggest, staying at 13.1%.
Imports of cotton yarn in Jan 2017 are expected to slip greatly affected by the Lunar Chinese New Year holiday, and cotton yarn imports are likely to shrink slightly throughout 2017.
II. Export data analysis
1. Cotton yarn export increased in 2016
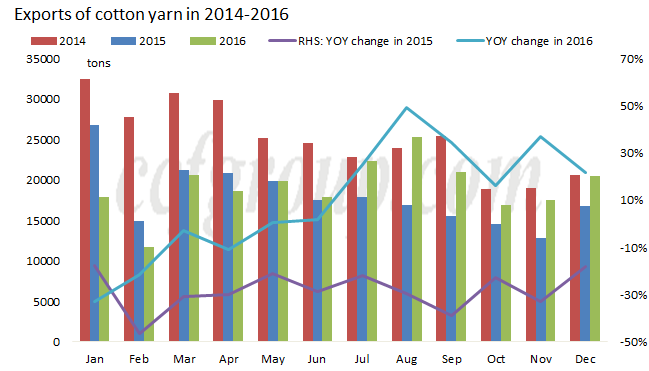
Exports of cotton yarn in 2016 totaled around 230.3kt, up 6.67% y-o-y, apparently better than last year. Exports of cotton yarn were growing except for Jan-Apr, 2016.
2. Export structure changed little
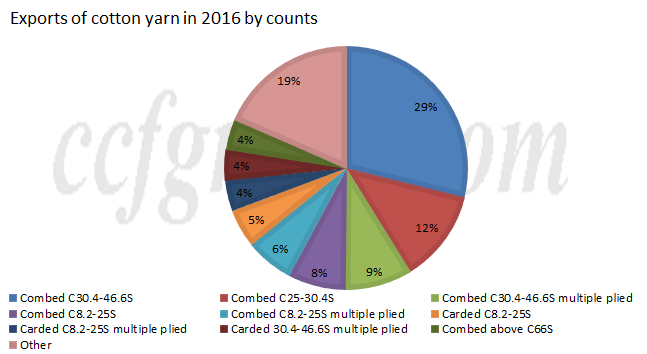
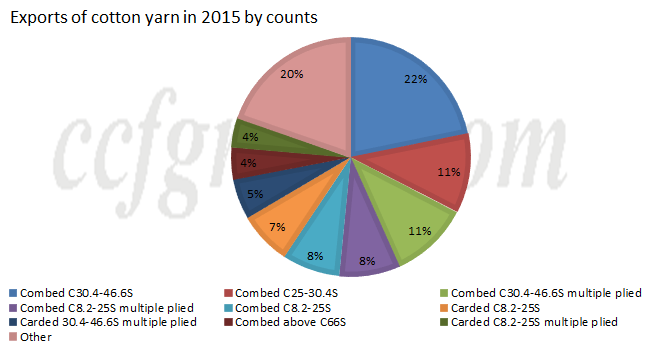
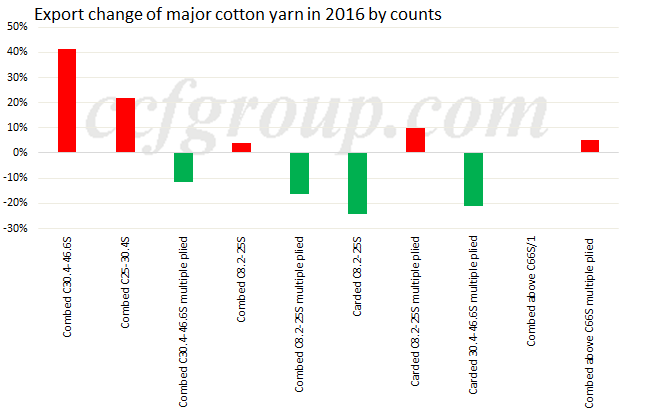
Export structure of cotton yarn did not change much in 2016. Combed 30.4-46.6S, combed 25-30.4S and combed 30.4-46.6S multiple plied yarn were major export descriptions, sharing around 50%. Exports of combed 30.4-46.6S and combed 25-30.4S hiked obviously in 2016, up by 41.5% and 21.8% y-o-y respectively, and market share of these two increased by 7% and 1% respectively to around 29% and 12%.
3. Exports of cotton yarn to Hong Kong and Vietnam kept reducing and that to Bangladesh and Philippines rose apparently
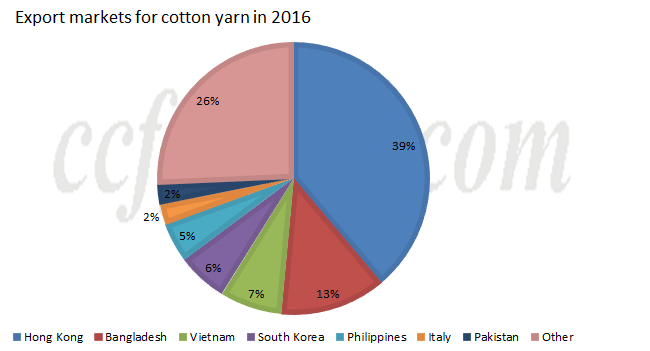
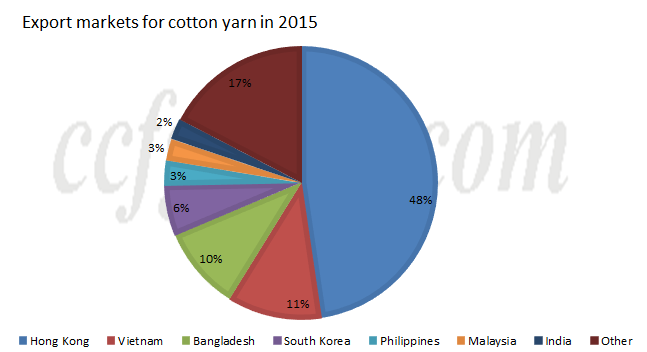
Hong Kong, Bangladesh and Vietnam remained the biggest export markets for cotton yarn in 2016, and exports to Bangladesh hiked by 42.9% on the year, with market share up by 3% to 13%, and exports to Hong Kong and Vietnam continued decreasing by around 8.64% and 26.03% respectively, with proportion down by 9% and 4% respectively to 39% and 7% respectively.
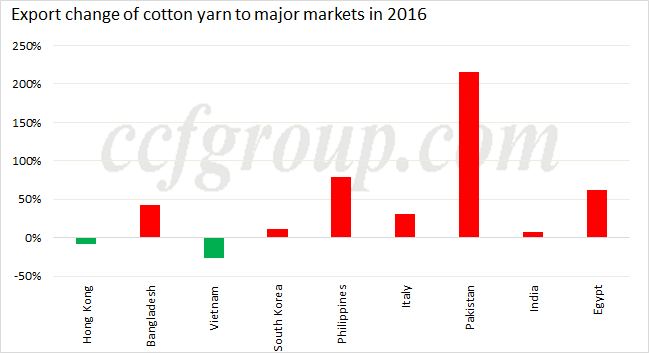
Exports of cotton yarn to Philippines and Pakistan surged in 2016, up by 78.89% and 215.08% on the year respectively.
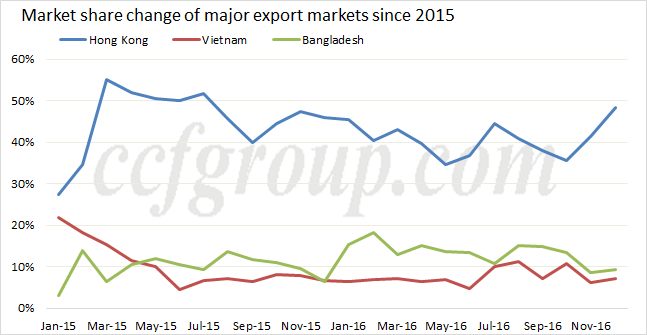
Monthly proportion of Hong Kong averaged at around 40% in 2016, and Bangladesh exceeded Vietnam to be the second largest export market since May 2015.
Exports of cotton yarn increased in 2016, which was mainly attributed to the growth from Bangladesh and Philippines where textile and apparel industry is emerging. Besides, exports improved in the second half of 2016, which was related to rising price cotton product and depreciating RMB.