Analysis of cotton yarn import
1. Imports of cotton yarn
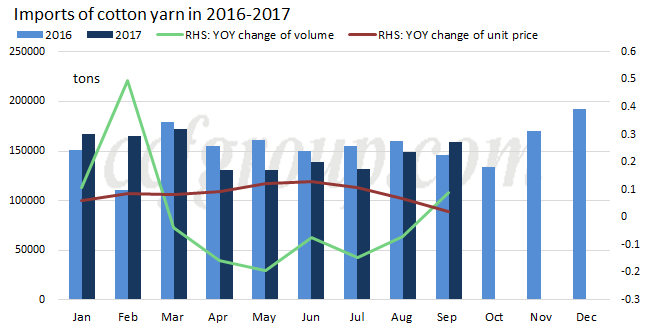
Imports of cotton yarn (Hs code: 5205, the following analysis is all based on this Hs code) increased by 6.7% m-o-m and 9.04% y-o-y respectively to 159.2kt in Sep 2017, the first time up on the year in recent 7 months, which was mainly attributed to firmer RMB and enhanced advantage of imported cotton yarn. Import unit price of cotton yarn declined on the year in Sep when price of forward cotton yarn slipped on poor demand from China in Jul-Aug. Cotton yarn imports reduced by around 1.6% y-o-y to 1345.9kt in Jan-Sep, 2017.
2. Major origins for imported cotton yarn
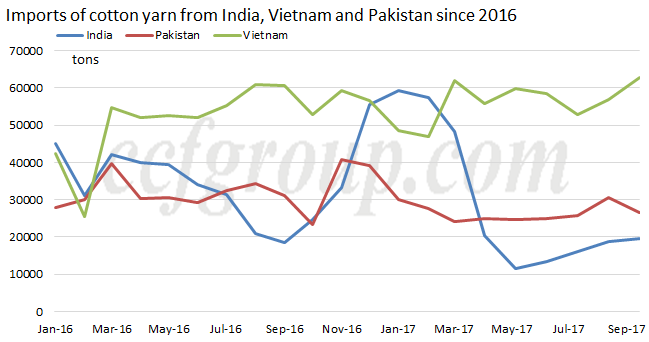
Vietnam, Pakistan and India remained major suppliers for imported cotton yarn in Sep, with import volume at 63kt, 27kt and 20kt respectively and share at 41%, 17.36% and 12.83% respectively. Imports of Vietnamese and Indian cotton yarn increased in Sep, while those of Pakistani cotton yarn slipped. Supply of Pakistani cotton yarn was inadequate after price hiked last month and capacity impacted this year.
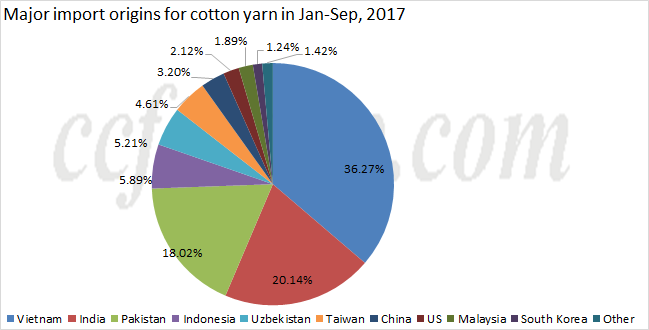
Vietnam, India and Pakistan were the top suppliers for imported cotton yarn in Jan-Sep, 2017, occupying around 36.27%, 20.14% and 18.02% respectively, followed by Indonesia and Uzbekistan with proportion above 5%, and the next was Taiwan China.
3. Major imported cotton yarn by count
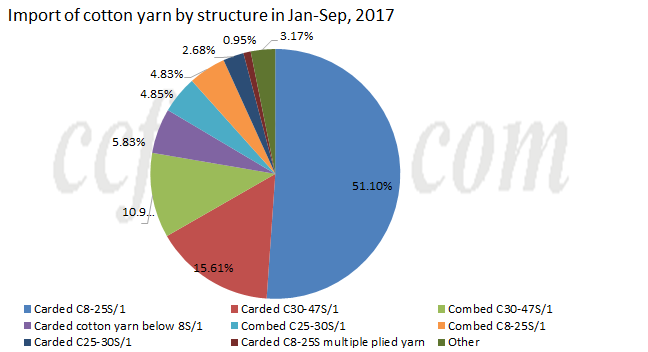
Carded 8-25S/1 was the biggest cotton yarn imported in Jan-Sep, 2017, taking up 51.1% of the total, followed by carded 30-47S/1 and combed 30-47S/1 with share at 15.61% and 10.98% respectively. Proportion of other cotton yarn was below 5%.
| Unit: tons |
Aug-17 |
Sep-17 |
MOM change |
| Carded C8-25S/1 |
77,719,603 |
79,433,238 |
2.20% |
| Carded C30-47S/1 |
21,911,658 |
26,045,401 |
18.87% |
| Combed C30-47S/1 |
14,099,422 |
17,292,119 |
22.64% |
| Carded cotton yarn below 8S/1 |
11,556,057 |
9,919,980 |
-14.16% |
| Combed C8-25S/1 |
6,772,763 |
7,775,072 |
14.80% |
| Combed C25-30S/1 |
5,926,861 |
7,153,017 |
20.69% |
| Carded C25-30S/1 |
4,843,506 |
4,381,140 |
-9.55% |
| Carded C8-25S multiple plied yarn |
1,194,647 |
794,210 |
-33.52% |
| Other |
5,200,060 |
6,429,555 |
23.64% |
Carded 8-25S/1 was the biggest cotton yarn imported in Sep, with volume at 79.4kt and share up by 9.43%, and followed by carded 30-47S/1, with volume at 26kt. Imports of combed 25-30S/1 in Sep grew apparently on the month.
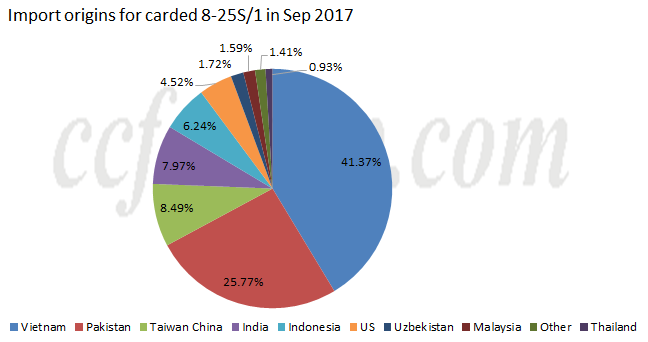
Imports of carded 8-25S/1 increased by 2.2% to 79.4kt in Sep, mainly from Vietnam and Pakistan. Vietnam possessed the top rank, sharing around 71.37%, and Pakistan shared around 25.77%, ranking the second place, followed by Taiwan, occupying around 8.49%, which was attributed to the tolerable demand for open-end cotton yarn.

Imports of Indian carded 8-25S/1 slipped greatly since Mar 2017, and those from Vietnam surged, with Vietnam ranking the first place. Proportion of Pakistan gradually slipped, and that of Taiwan also move down. But Taiwan China was the third largest import origin for carded 8-25S/1 in Sep, followed by India.
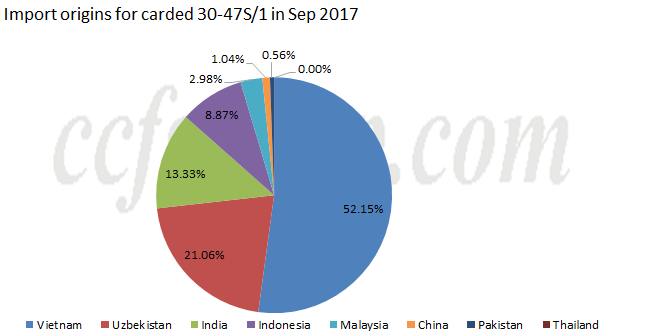
Imports of carded 30-47S/1 increased 18.87% m-o-m to 26kt in Sep 2017, and Vietnam was the biggest supplier, sharing around 52.15%, followed by Uzbekistan, taking up 21.06%. Proportion of India dropped by around 5% to 13.33%, ranking the third place, and that of Indonesia dipped to 8.87%.
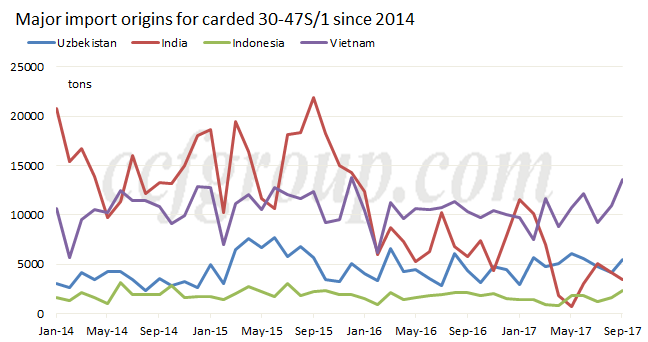
India enjoyed advantage in carded 30-47S/1 since 2014, but the advantage was snatched by Vietnam since Mar 2016. Imports of Indian carded 30-47S/1 slipped to low level since Apr 2017 but recovered from Jun. In Sep 2017, proportion of Vietnamese carded 30-47S/1 increased further, that of Uzbekistani ones rose and that of Indian ones kept falling.
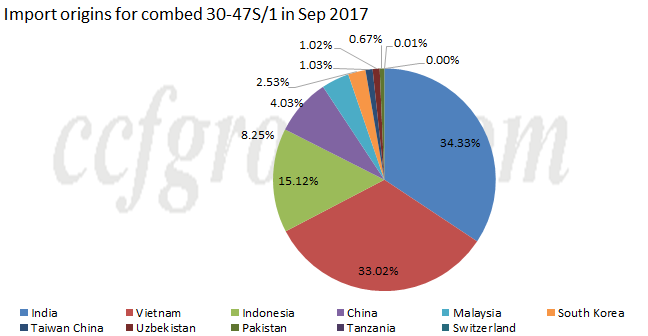
Imports of combed 30-47S/1 increased by 22.64% on the month to 17.3kt in Sep 2017, and India was the biggest origin, sharing around 34.33%. Vietnam was not the largest supplier this time, with share up to 33.02%, and Indonesia shared around 15.12%, possessing the third position.
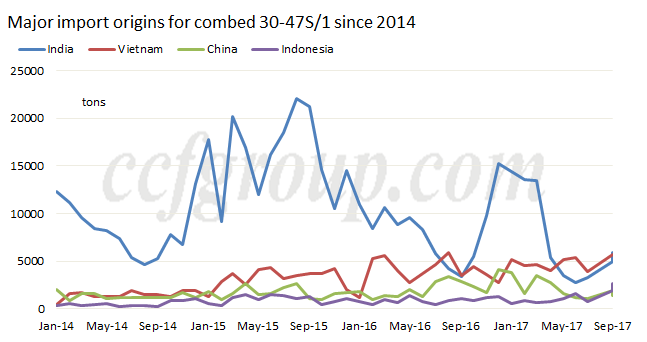
India enjoyed absolute advantage in combed 30-47S/1 but the volume kept falling since the beginning of 2016 and ranked the second place after Aug 2016, but regained the first position since Oct 2016. But imports of Indian combed 30-47S/1 shrank apparently since Jan 2017, and Vietnam became the largest supplier in May. India became the largest supplier in Sep 2017, and imports of combed 30-47S/1 from Vietnam, India and Indonesia climbed up.
4. Import unit price
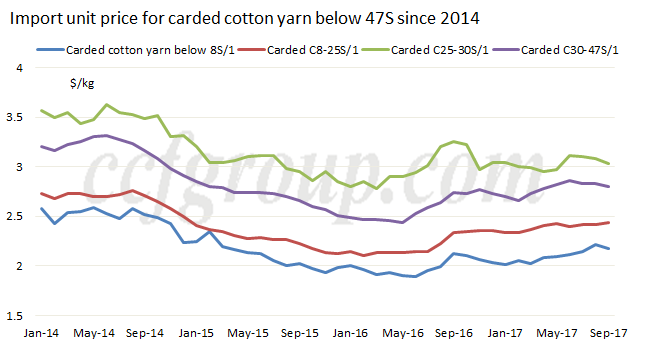
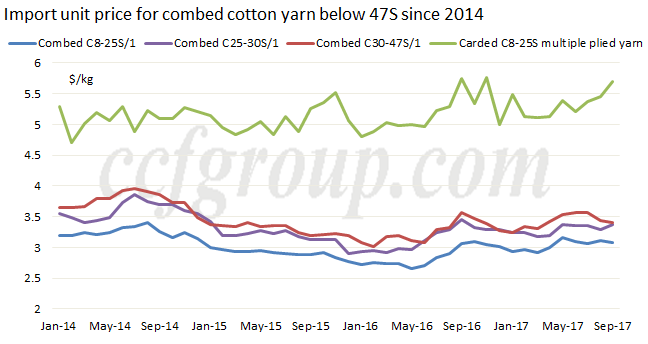
As for the average import unit price for major cotton yarns, it started falling since Oct 2016. Price of imported cotton yarn generally firmed up since Mar 2017, especially combed ones, but price of forward cotton yarn started falling since Jun. Price of carded cotton yarn was stable to weak in Sep 2017, and decrement of carded cotton yarn below 8S/1 was more apparent. Price of combed 8-25S/1 and multiple plied yarn firmed up in Sep on moderate demand, but price of other descriptions slipped on poor demand.
5. Summary
Imports of cotton yarn (Hs code: 5205, the following analysis is all based on this Hs code) increased by 6.7% m-o-m and 9.04% y-o-y respectively to 159.2kt in Sep 2017, the first time up on the year in recent 7 months, which was mainly attributed to firmer RMB and enhanced advantage of imported cotton yarn. Import unit price of cotton yarn declined on the year in Sep when price of forward cotton yarn slipped on poor demand from China in Jul-Aug. Cotton yarn imports reduced by around 1.6% y-o-y to 1345.9kt in Jan-Sep, 2017.
Vietnam, India and Pakistan were the top suppliers for imported cotton yarn in Jan-Sep, 2017, occupying around 36.27%, 20.14% and 18.02% respectively, followed by Indonesia and Uzbekistan with proportion above 5%, and the next was Taiwan China.
Carded 8-25S/1 was the biggest cotton yarn imported in Jan-Sep, 2017, taking up 51.1% of the total, followed by carded 30-47S/1 and combed 30-47S/1 with share at 15.61% and 10.98% respectively. Proportion of other cotton yarn was below 5%.
Imports of cotton yarn may be largely stable and ample in Oct with firmer RMB and peak-season anticipation but trading of forward cotton yarn was modest after National Day holiday, while imports of Indian cotton yarn in Oct may rise. Price of Oct arrivals imported cotton yarn may be firm when price of forward cotton yarn climbed up in Sep. Traders saw shrinking profit after National Day holiday with weaker demand and falling Chinese cotton yarn. Price of Indian cotton is supposed to be supported in Nov, and Indian cotton yarn price is expected to be flat. Profit of forward cotton yarn still exists under current price, and the supply and demand of cotton should be noted.
Analysis of cotton yarn export
1. Cotton yarn exports kept growing in the first three quarters

Cotton yarn (Hs code: 5205, the following analysis is all based on this Hs code) exports increased by 20.99% y-o-y and 7.49% m-o-m respectively to 25.3kt in Sep 2017, and exports totaled 187.8kt in Jan-Sep, 2017, up 7.11% on the year.
2. Exports of most cotton yarn descriptions increased
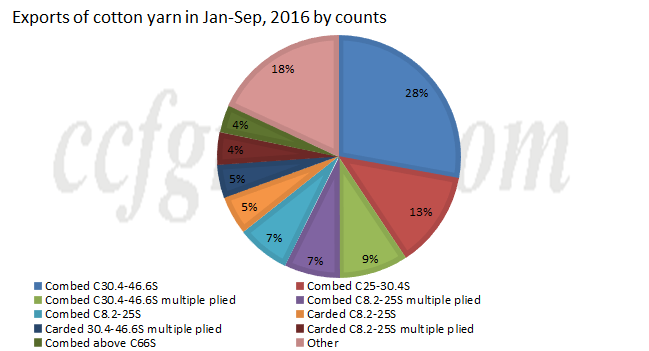
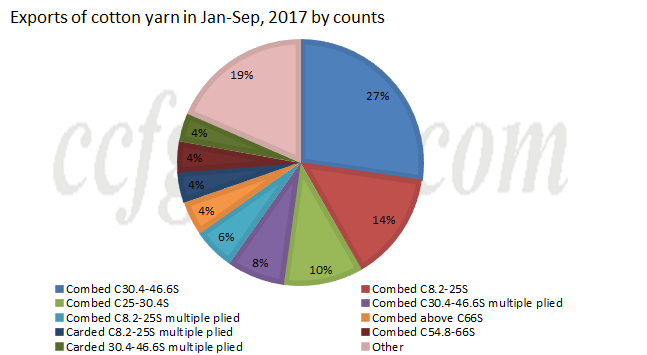
As for export structure, major exported cotton yarns changed little in Jan-Sep, 2017 but the rank altered. Combed 8.2-25S exceeded combed 25-30.4S to be the second largest variety exported, and export share of combed 8.2-25S rose by 7% to 14%, while proportion of combed 25-30.4S reduced by 3% to 10%.
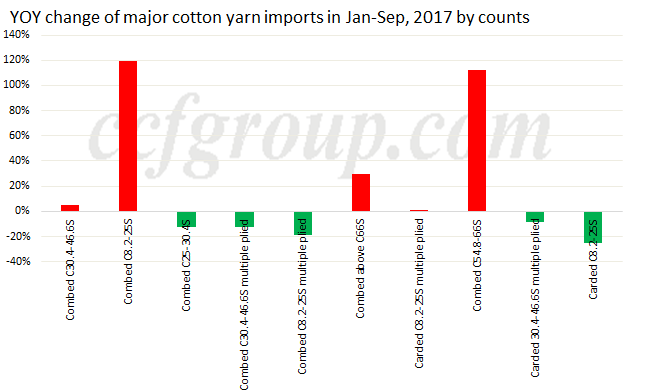
In view of export volume of cotton yarn, exports of combed 8.2-25S/1 and combed 54.8-66S/1 grew apparently, with increment at 119.66% and 112.48% respectively in Jan-Sep, 2017.
3. Exports of cotton yarn to the Philippines and Pakistan surged
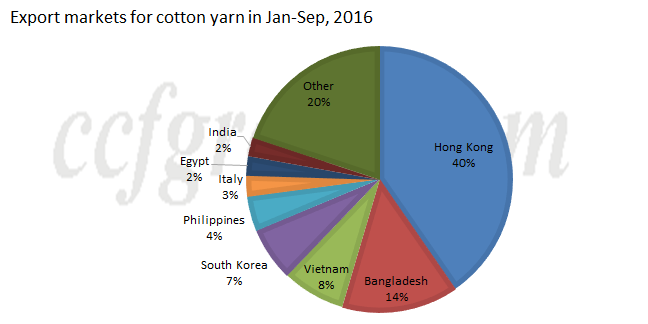
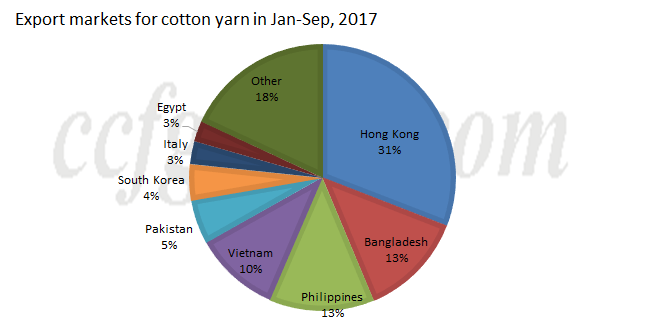
Market share of cotton yarn exported to Hong Kong, Bangladesh and South Korea declined on the year in Jan-Sep, 2017, with that of Hong Kong down by around 9%, and proportion of cotton yarn exported to Vietnam rebounded by around 2%. Exports of cotton yarn to the Philippines grew by around 9% to 13%, and Philippines became the third largest export destination. Pakistan soared to the fifth largest export market, with share at around 5%.
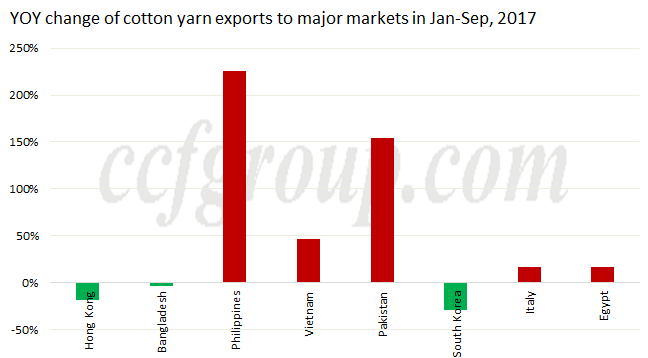
Bangladesh was a black horse in 2016 but exports of cotton yarn to Bangladesh inched down in 2017, with decrement at around 3.2% in the first three quarters. Exports of cotton yarn to the Philippines and Pakistan soared by around 225.11% and 154.53% on the year respectively in Jan-Sep, 2017.
In summary, exports of cotton yarn kept growing in the first three quarter of 2017, with growth at around 7.11%. Exports of combed 8.2-25S and 54.8-66S increased the most apparently, with increment at 119.66% and 112.48% respectively in Jan-Sep, 2017. Exports of cotton yarn to Hong Kong inched down in the first three quarter of 2017, and those to Bangladesh inched down by around 3.2%, while exports of cotton yarn to the Philippines and Pakistan soared by around 225.11% and 154.53% on the year respectively in Jan-Sep, 2017.