|
|
|
home > Events
China PET bottle chip export maintains high growth in May
According to the Customs, China PET bottle chip export volume totals 288kt in May 2019, up 65kt or 29% y-o-y, month on month rising 35kt or 13.8%. Jan-May overall exports totaled 1.41 million tons, up 23% on annual basis. If adding some low viscosity exports (under HS code 39076910), Jan-May figure amounted to 1.52 million tons, y-o-y rising 28%. 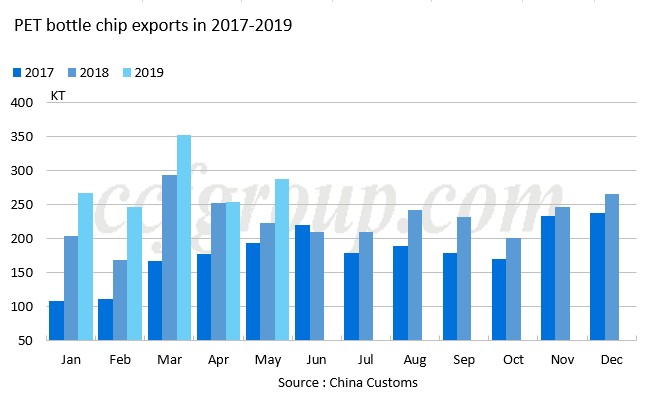 Note: merely statistics from HS code 39076110 Note: merely statistics from HS code 39076110 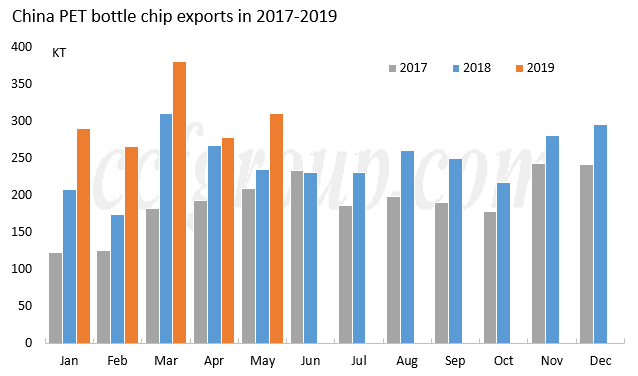 Note: statistics combines HS code 39076110 and 39076910 PET bottle chip export order intake totaled 320kt in May, and trading focused on the second half month. Jun export order intake is assessed at 250-300kt. Late May-H1 Jun, overseas competitors in South Korea, India and Southeast Asia reacted slowly toward the export price, while China export value closely followed feedstock trend, hence Sino-foreign price spread enlarged rapidly. China regained cost advantage and export sales increased substantially. Note: statistics combines HS code 39076110 and 39076910 PET bottle chip export order intake totaled 320kt in May, and trading focused on the second half month. Jun export order intake is assessed at 250-300kt. Late May-H1 Jun, overseas competitors in South Korea, India and Southeast Asia reacted slowly toward the export price, while China export value closely followed feedstock trend, hence Sino-foreign price spread enlarged rapidly. China regained cost advantage and export sales increased substantially. 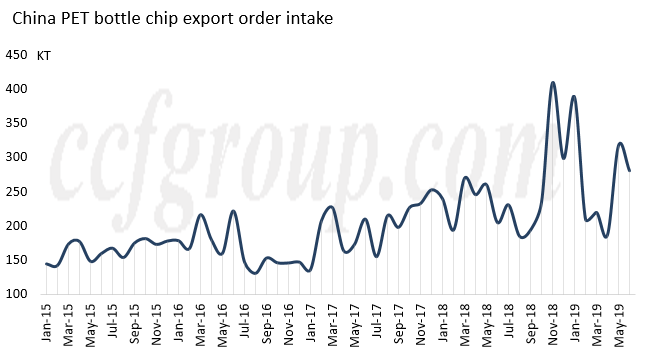 China exports to major destinations was steady, largely marking y-o-y growth. Details refer to below figure. Figure 1. China PET bottle chip exports y-o-y growth in May China exports to major destinations was steady, largely marking y-o-y growth. Details refer to below figure. Figure 1. China PET bottle chip exports y-o-y growth in May | Export destination | 19-May | 18-May | Y-o-y growth | | India | 30.6 | 10 | 206% | | Russia (RU) | 19.7 | 12.6 | 56% | | Algeria | 14.9 | 9.8 | 51% | | Ukraine | 11.8 | 9.6 | 22% | | Peru | 11.7 | 9.3 | 26% | | Philippines | 11.6 | 8.9 | 31% | | South Korea | 9.1 | 7.1 | 29% | | United Arab Emirates | 9 | 1 | 808% | | Turkey | 8.4 | 10.8 | -22% | | Kazakhstan | 7.6 | 7.2 | 6% | | Egypt | 5.1 | 16.2 | -68% | | South Africa | 3 | 7.4 | -60% | | Italy | 4.044 | 1.406 | 188% | | France | 4.158 | 1.012 | 311% | | Poland | 1.276 | 0 | | | Spain | 1.232 | 0 | | | Belgium | 4.532 | 0.342 | 1225% | Apart from traditional destinations, EU market also has highlight. Since China PET export price enjoys obvious cost advantage late May, and EU local plants including JBF, NEO and Equipolymer have output cut plan, EU imports from China expanded substantially, reaching 3-4 digit percentage growth. Besides, exports to UAE is 8 times the volume of May 2018. According to China producers’ analysis, it’s mainly low-rates orders nailed in previous stage, merely delivered in May. Besides, UAE’s sharp growth could also be attributed to low base of 2018 and unstable operation of local plants. Meanwhile, China PET resin exports to Egypt and Turkey saw drastic decline, due to new capacity release, with May y-o-y growth falling 68% and 22% respectively. Apart from capacity expansion, China materials lost price advantage heading to Middle East. South Africa market also marked 60% y-o-y drop, on anti-dumping investigation. With feedstock price surging, China PET bottle chip export value rallies again, standing higher than surrounding countries, hence if feedstock cost continues rising or maintains high and prices of surrounding countries don't follow up, China export order intake will be restrained. Since Apr order intake totaled less than 200kt, though May-Jun sales are tolerable, they are mainly forward deals, hence Jun export volume is still worth concern while Jul export data may fare well.
|
|